Analytics
The best of Salesforce Summer ‘22 Release Features, Analytics Edition
Your Salesforce data just got upgraded

With the new Summer ’22 Release, you’ll find a variety of enhancements to Salesforce Reports and Dashboards, as well as CRM Analytics, the feature formerly known as Tableau CRM, formerly known as Einstein Analytics. (It’s a lot, we know.)
Reports and Dashboards
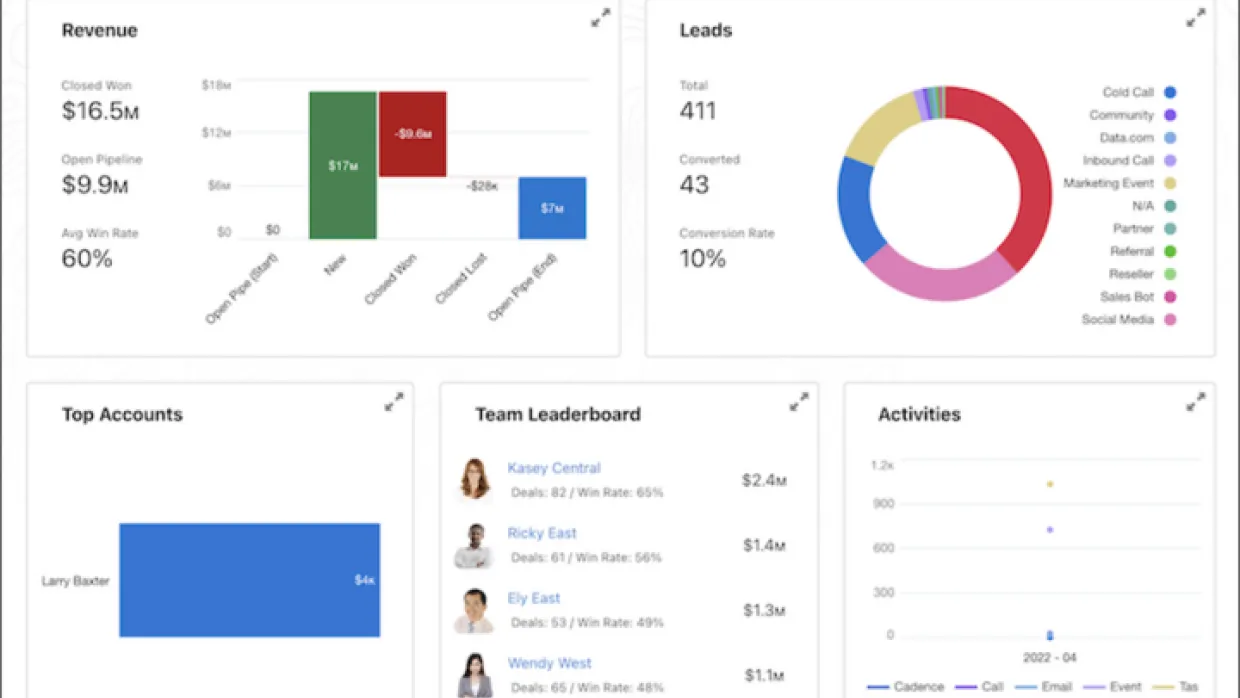
1) Hands down, the best new feature is the new Analytics Home (Beta) page. Finally, a place where we can find all of our lightning reports and dashboards in one place!
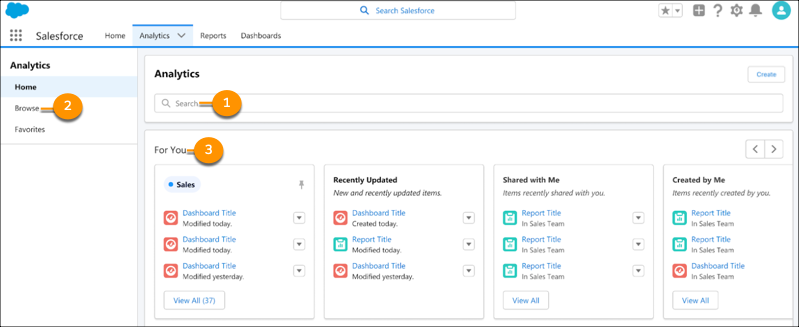
Don’t worry! Reports and Dashboards will still keep their own tabs too.
2) Find the report type you need, faster and easier. Raise your hand if you’ve ever had to rebuild a report over and over, because once you got in there you realized you didn’t have a certain field or object. Filter report types by objects, view included fields, and select previously used reporting formats. Now we can quickly recreate and modify an existing report that we know meets our needs. And no more digging through all the report types to figure out what works - all we need to do is filter!
3) Is your data skewed? Let’s find out. The newly added “summarize metrics by median” is your answer. Using median value lets you better understand the distribution of data - when you compare it with the mean value, we can determine if the data is skewed in either direction.
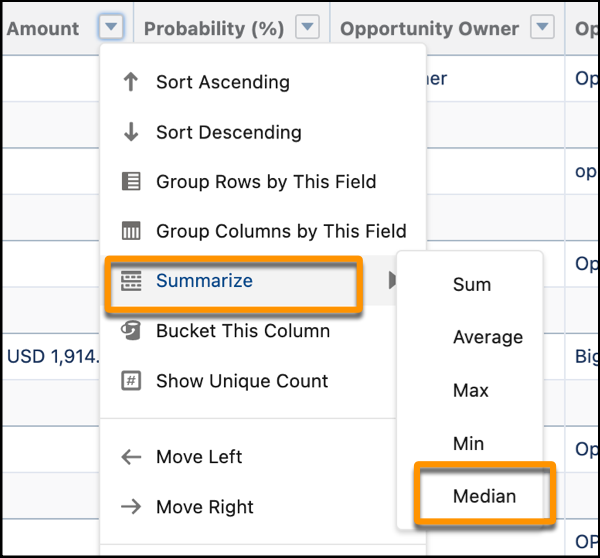
Where to apply this: If I want to know how long particular cases have been 'Open' in Salesforce, mean wouldn’t work if there are outliers. Why? Outliers will skew heavily in one direction (i.e. cases that have been left open accidentally for months). Median tells you what value is at the center of your distribution.
CRM Analytics (Tableau CRM, remember?)
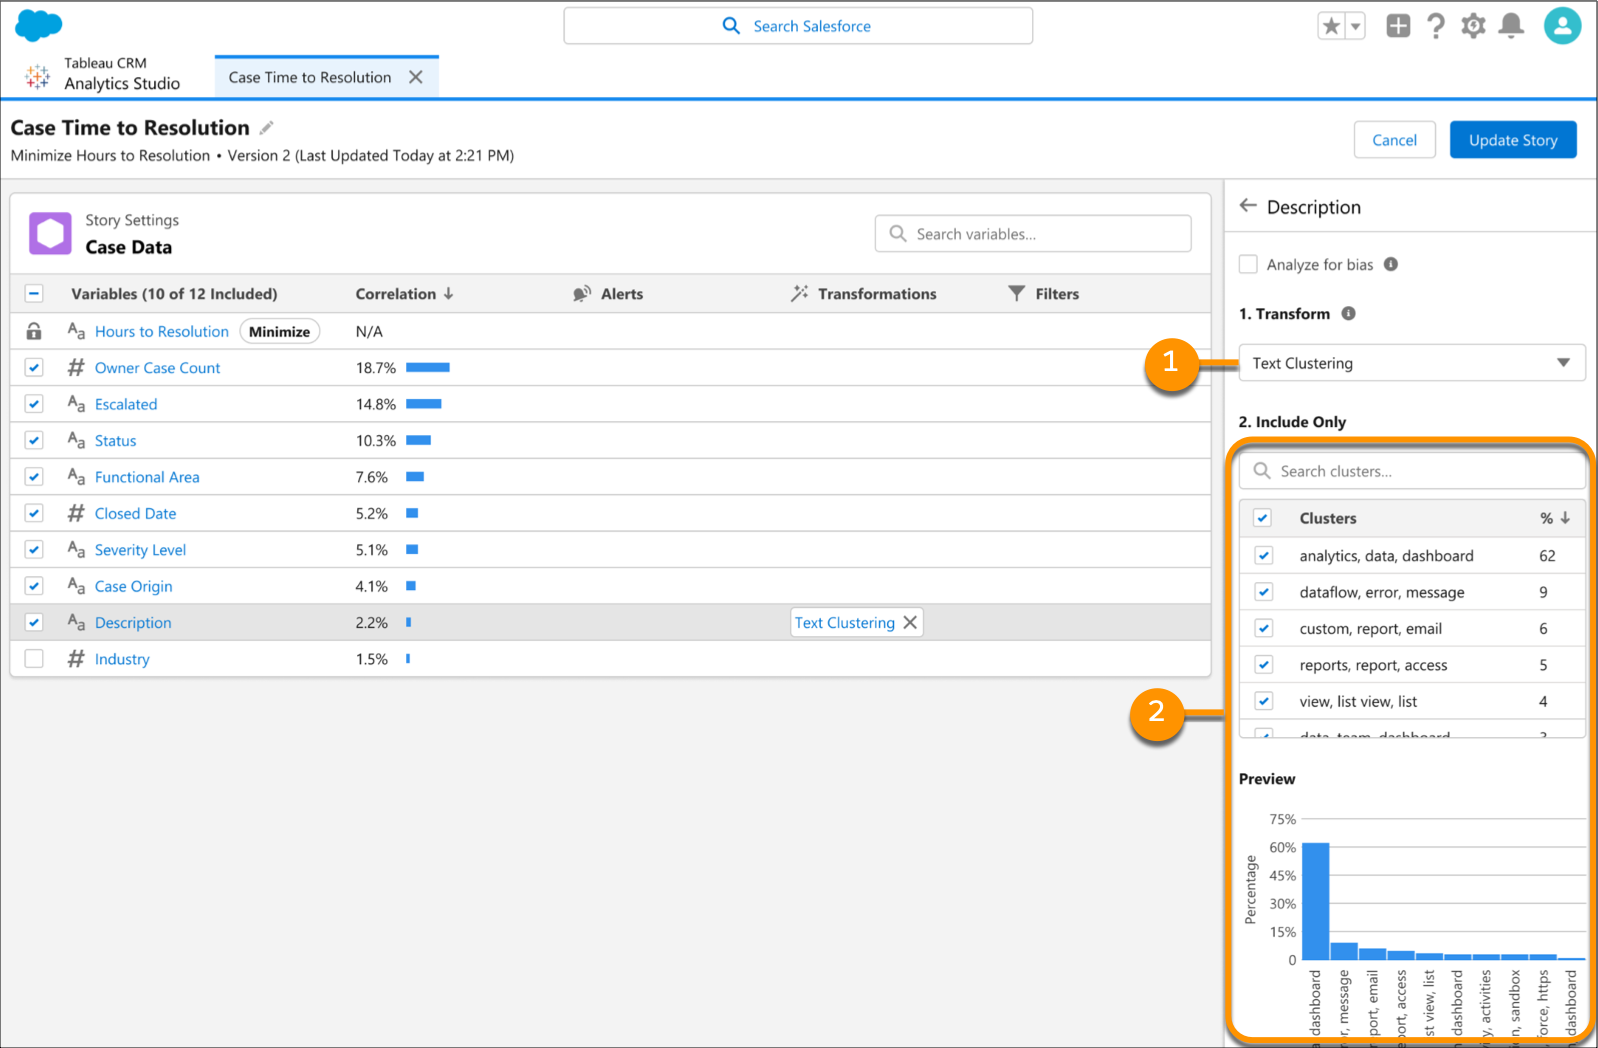
1) Text Clustering lets you tap into your unstructured data (Unstructured data, huh? Think: social media posts, product reviews, surveys, emails, etc.) Text data can often be one of the most underutilized forms of data.
How it works: This tool creates a frequency index for all the words used in the text content and then removes the common words such as a, and, the.
When to use it: Let’s start with a collection of product reviews. A company can run this analysis and might find multiple reviews that mention their product leaks after prolonged use. This information can quickly be transmitted back to the product development team and appropriate adjustments can be made.
2) Accessibility Matters. 1 in 4 adults in the United States have some type of disability. A topic near and dear to our hearts here at Horizontal, we are pleased to see the continued commitment from Salesforce to make platforms and tools accessible to everyone.
Here’s what’s new in TCRM (okay, fine, CRM Analytics):
-
- Screen readers will read the alt text in dashboard image components.
- List, Date, and Global Filter widgets are now buttons and screen readers can correctly identify them as actionable.
- The widget action menu supports accessible actions and narration.
- Filter lists support navigation using the up and down arrows.
3) Mobile App Upgrades: Wait, there’s a mobile app just for analytics? Yes! And it just got even better. Stay up to date when you’re on the go with easier to read data like text wrapping inside tables. Make sure you upgrade to version 15.1 of CRM Analytics for iOS and Android.
Truth be told, we could go on forever about each of the CRM Analytics features we’re gushing over. If you’d like to connect with our team of Analytics experts and Data Scientists to learn how you can better leverage these enhancements, we’re happy to chat! https://horizontaldigital.com/contact-us